- 基本運算:FFT
FFT是頻譜分析的基礎,以下的四種分析功能均以FFT變換的結果為基礎,再進行二次處理得到。
FFT變換的結果為復數,含有原始信號的相位信息。
注:測試周期穩態振動信號RMS的用戶請注意:請選擇自功率譜進行測試,FFT功能要求相位對齊,如果在相位不對齊的情況下,測得的數值并不準確。
- 自功率譜:auto power spectrum,Gxx
自功率譜直接從FFT變換的結果求出,
自功率譜不帶相位信息,因此不要求相位對齊。
1.9.5以后版本的APS帶聲學記權功能
此功能多用于振動信號的能量或rms測試。
計算過程:
To compute the spectra listed above, follow these steps:
Step 1
A window is applied:
x(k) = w(k) x(k)’
where x(k)’ is the original data and x(k) is the data used for a Fourier transform.
Step 2
The FFT is applied to x(t) to compute Sx
Now, periodogram method is used to compute the spectra with area correction
Step 3.1
Power Spectrum Sxx = Sx Sx* / (LineCorr)2
Step 3.2
Power Spectral Density = Sx Sx* T / AreaCorr
Step 3.3
Energy Spectral Density = Sx Sx* T2 / AreaCorr
Step 3.4
RMS Spectrum =
where T is the time duration of the capture. The symbol * is for complex conjugation. AreaCorr is a factor for area correction, which is defined as:
N is the total number of the samples and w(k) is window function.
- 互功率譜:cross power spectrum,Gxy
互功率譜需要由兩個輸入通道:激勵通道和響應通道,默認第一通道為激勵通道。
計算過程:
To compute the cross-power spectral density Gxy between channel x and channel y:
Step 1, compute the Fourier transform
Step 2,?? compute the instantaneous cross power spectral density
Sxy = Sx*?? Sy T
Step 2,?? average the M frames of Sxx to get averaged PSD Gxx
Gxy’ = Average (Sxy)
Step 3,?? Do area correction and double the value for single-sided spectra
Gxy = 2 Gxy’ / AreaCorr
- 傳遞函數(transfer function):FRF,Hxy
傳遞函數需要由兩個輸入通道:激勵通道和響應通道,默認第一通道為激勵通道。此功能最多用于錘擊試驗。
傳遞函數(transfer function)的計算實質是響應通道與激勵通道的互功率譜比上激勵通道的自功率譜得到:
The cross power spectrum method is used for estimating the transfer function between channel x and channel y. The equation is:
where Gxy is the averaged cross-spectrum between the input channel x and output channel y. Gxx is the averaged auto-spectrum of the input. Either power spectrum, power spectral density or energy spectral density can be used here because of the linear relationship between input and output.
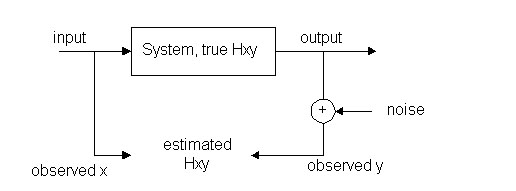
This approach will reduce the effect of the noise at the output measurement end, as shown below.
The transfer function has a complex data format. Your can view it in real, imaginary, magnitude or phase display format.
- 相關系數: coherence,Coh(x,y)
傳遞函數譜需要由兩個輸入通道:激勵通道和響應通道,默認第一通道為激勵通道。
The coherence function is defined as:
where Gxy is the averaged cross-spectrum between the input channel x and output channel y. Gxx and Gyy are the averaged auto-spectrum of the input and output. Either power spectrum, power spectral density or energy spectral density can be used here because of the linear relationship between input and output.
When the averaging number is 1, coherence function has a meaningless result of 1.0 due to the estimation error of the coherence function.
The coherence function is a non-dimensional real function in the frequency domain. You can only view it in the real format.
Note: When describing a system with input x and output y as shown above, some people are used to a notation Hyx instead of Hxy. The most Most DSA products follow the convention used in the reference books listed before. Hxy stands for a transfer function with input x and output y.

